If you thought housing statistics last year were a rollercoaster, hold on to your hats—we’re going to see even more dramatic housing market stats in the coming months.
Over the last few years, local Canadian housing markets have slowly and quietly been developing market imbalances. These were pushed into the spotlight in 2020 as stronger than expected demand outpaced new listings, depleting inventories to levels not seen in 30 years. Many markets are seeing record high sales and prices coupled with record low new supply and inventory. Yes, things are very strong and don’t look to be slowing down.
That said, it may be good to provide advance notice this spring market will bring some unique and absurdly large market variations. Year-over-year comparisons will reflect the chasm between the current extremely high market activity and the extreme lows from last year’s spring market when the COVID-19 pandemic brought communities to a standstill and put a pause on housing market activity nationwide.
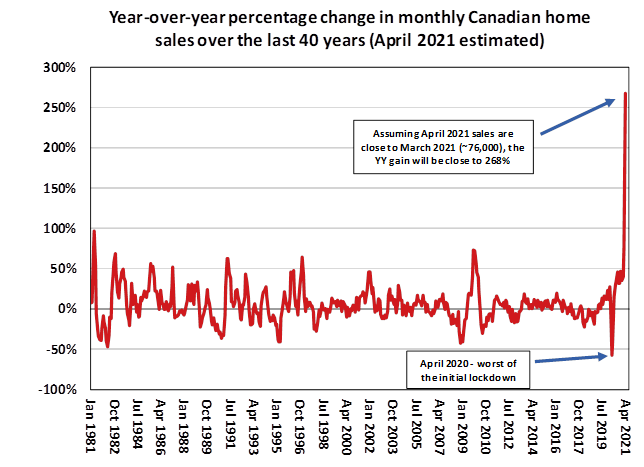
Consider we initially entered lockdowns last year right before the spring market could really get into gear, and the market was put on pause for three months. For example, in April 2020, the number of homes sold nationally was 20,770, despite the five-year average between 2015-2019 being around 51,743 units, which is more in line with typical buying patterns we see during the month of April. This was a dramatic drop of almost 60% compared to the five-year average.
While that looks like a long way for sales to go down, we have to remember percentage changes on the way down require a larger percentage gain on the way up to get back to initial levels. We can show this by looking at sales activity again. We know they were down last year by about 60%, but for sales to get back to their five-year average of 51,743, the percentage gain would end up being close to 150%! This concept also works in reverse, so if you have a gain of 300%, say going from 10 sales to 40 sales in a market, you only need a reversal of 75% to get back to the initial 10 sales.
Let us (conservatively) speculate a bit by assuming that April 2021 national sales numbers will post similar figures as March 2021, about 76,000. Looking at the chart below, you can see if April 2021 numbers came in line with March, the year-over-year percentage change would be close to 270%. Wow!

The point is, when looking at last April’s drop in sales on a percent basis and what kind of a percentage increase it would take to get all the way back up … we’re going to be way higher than that!
Markets are red-hot now, and with the nature of current market conditions and the coincident timing of the spring market and COVID-19 shutdown last year, this will further exacerbate comparisons between 2021 and 2020. Undoubtably, the pandemic will have a distorting impact on housing markets for years to come, and how those numbers show up in the statistics. To help better understand housing market trends, as well as other economic factors that affect real estate markets, visit CREAStats.ca.


